#30DayMapChallenge
We make maps, lots of maps and we make maps matter. Our maps provide insight and information to help decision makers working in fragile and complex places.
We were happy to join in the 2022 #30DayMapChallenge. Here are our maps.
2022 Map Challenge
Day 1
Points
Theme:

We visualised our population data points and combined with the 2021 Drought index data to assess the impact of drought in #Afghanistan.
Day 2
Lines
Theme:

Using 20 different input layers we generated a multi-criteria analysis tool that connected the different points of the dairy value chain in Afghanistan.
Day 3
Polygons
Theme:

Afghanistan is home to hundreds of different tribes and groups. These polygons show the different tribal regions along the Helmand River.
Day 4
Green
Theme:

We are celebrating the green spaces of Guildford. Just 28 miles from London Guildford is in the heart of the most wooded county in Britain, Surrey.
Day 5
Ukraine
Theme:

We looked at lights at night across #Ukraine in April 2022 and compared it with April 2021. What a difference.
Day 6
Network
Theme:

We used the Esri Network Analysis Tool and Open Street Map roads data to establish distances travelled to reach urban centres.
Day 7
Raster
Theme:

We compared the work of Drop In The Bucket who build wells & sanitation systems in Africa with population data in Uganda.
Day 8
OpenStreetMap
Theme:

We added 10,319 new huts to the OpenStreetMap data for Lamogi sub-region in northern Uganda to help NGOs working in this remote area.
Day 9
Space
Theme:

In Afghanistan, farmers have moved into the empty spaces of the desert. Using solar powered water pumps they drill deep into the ground for water.
Day 10
A Bad Map
Theme:

This might look like a good map but amongst other things it is just loads of data dumped onto a map. Not knowing what anything is made it a bad map.
Day 11
Red
Theme:

Taking different criteria such as distance to roads & markets, agricultural quality, we located the best places to develop earning and livelihood potential.
Day 12
Scale
Theme:

This shows the scale of the challenge to respond to people being displaced in Afghanistan. We detected 5,293 tents, nearly the size of 250 football pitches!
Day 13
5 Minute Map
Theme:

Here is a long five minutes.
Day 14
Hexagons
Theme:

Hexagons are a great way to visualise data. Here we show the change in population density as people moved into the desert in #Afghanistan.
Day 15
Food/Drink
Theme:

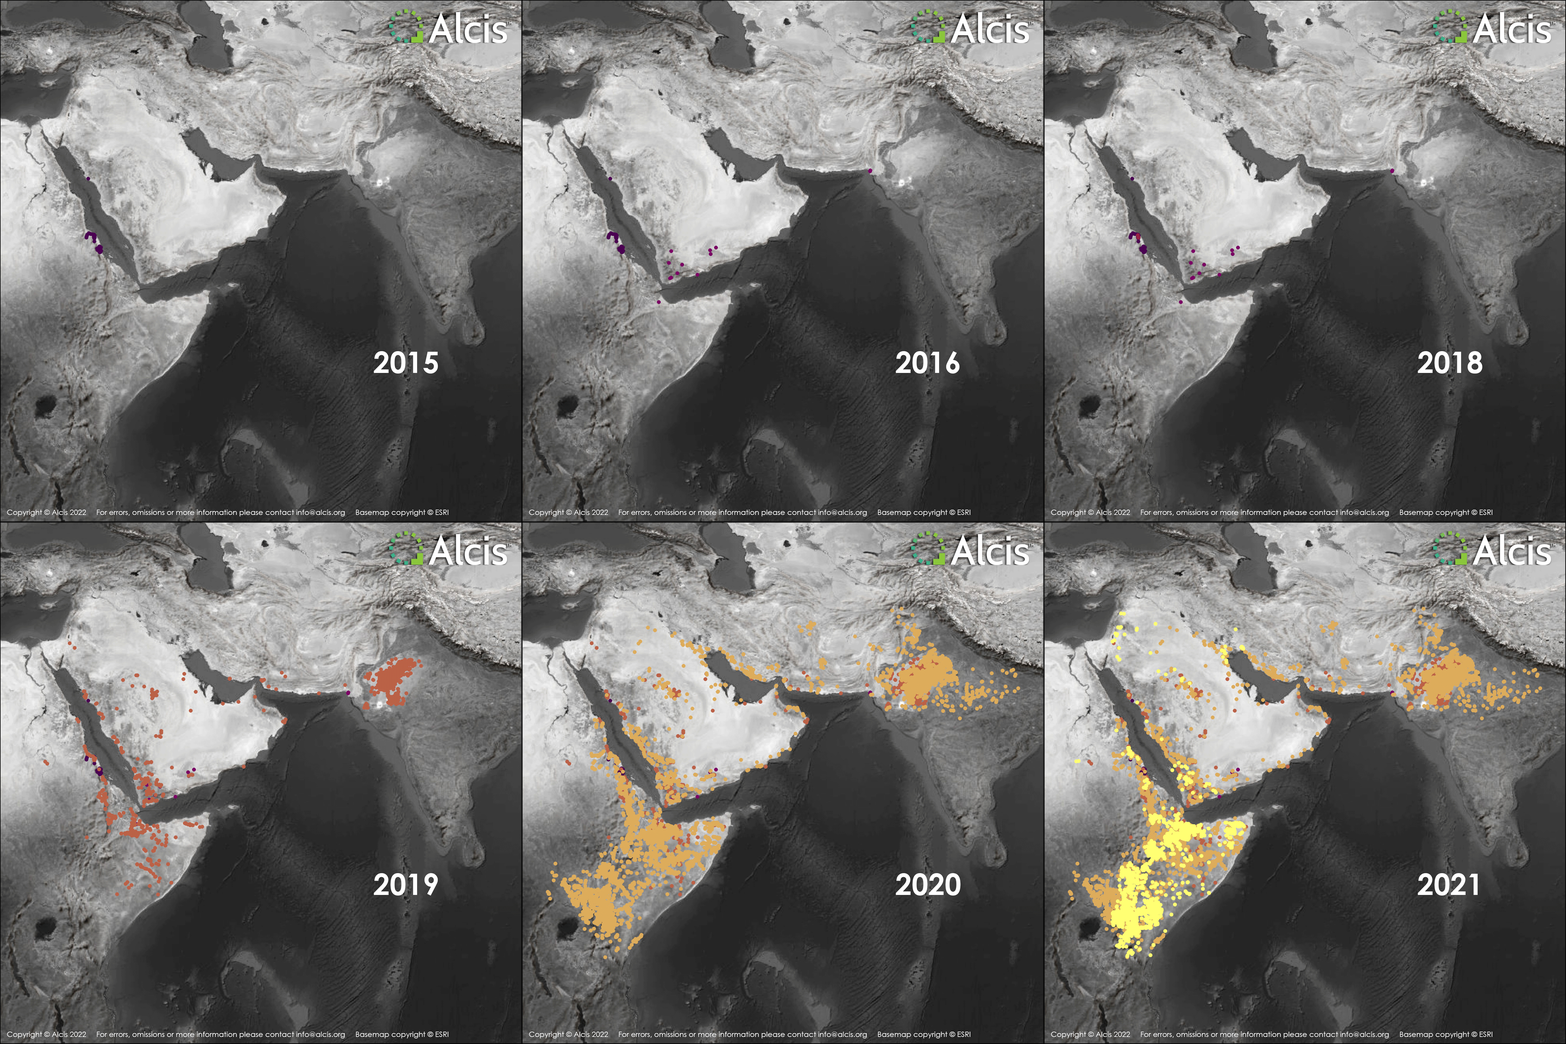
In parts of Africa locusts are a huge threat to food security. We used @FAO data to show where the swarms were from 2015 – 2021.
Day 16
Minimal
Theme:

Normally our maps are full of fascinating facts and data and it is unusual to see Afghanistan, where our work started in 2004, as a blank canvas.
Day 17
Map without a computer
Theme:

Drawn in 2009 this map shows the layout of a camp for internally displaced people in northern Uganda. The red dots are the huts.
Day 18
Blue
Theme:

Water is traditionally symbolised as blue on maps. Here water naturally destined for Iran is diverted south back into Afghanistan resulting in conflict between the 2 countries.
Day 19
Globe
Theme:

Alcis works on projects around the globe. We specialise in fragile and complex environments. Our goal is to improve the lives of the world’s most vulnerable people with maps and GIS.
Day 20
My Favourite
Theme:

We opted for our favourite animals and it is fair to say that they do represent the personalities of the team quite well!
Day 21
Kontur Population Dataset
Theme:

We used it to understand where health facilities are in relation to people in Lamogi sub county, northern #Uganda . We symbolised them by gradient size and colour points to give a sense of scale.
Day 22
NULL
Theme:

Day 22 of the #30DayMapChallenge and the theme is NULL. We decided to make a map showing the countries in the world whose name begins with N, U, L or L!
Day 23
Movement
Theme:

Our map follows the movement of methamphetamine produced from ephedra in Afghanistan. It shows the different points along the value chain as it progresses from mountain plant to processed drug.
Day 24
Fantasy
Theme:

This satellite image of the world is pure fantasy and is actually an AI generated map using Craiyon, a free online AI image generator from text.
Day 25
Two colours
Theme:

Using two colours, we carried out bivariate mapping to compare the intensity of the droughts in 2018 and 2021 across the Murghab Basin in Afghanistan.
Day 26
Island(s)
Theme:

In Timor-Leste the rise of sea levels is driving people away from the coast and their livelihoods. Our map shows the communities most at risk.
Day 27
Music
Theme:

Today our map shows all the countries that have won the Eurovision Song Contest!
Day 28
3D
Theme:

When glaciers retreat, they can form potentially hazardous proglacial lakes, which can be unstable and threaten settlements that are below them.
Day 29
Out of my comfort zone
Theme:

We have mapped global extremes, where we will all find ourselves feeling very uncomfortable indeed.
Day 30
Remix
Theme:

We have remixed our map from Day 8 and using more Open Street Map data have measured the distance of the huts in northern Uganda to local schools.